In recent years, there has been concern among policymakers about increasing consolidation in the U.S. health care system. One particular concern is that consolidation of health systems and hospitals (including physician practice acquisition) has reduced competition, leading to higher prices and potentially reduced benefits for patients.
Indeed, the worry has grown sufficiently that in 2023, the Federal Trade Commission and the U.S. Department of Justice released draft merger guidelines for the health care sector, seeking to promote transparency for employers and consumers, strengthen antitrust enforcement, and initiate reimbursement reform.1 In addition, 36 bills regarding the consolidation of health systems — ranging from contractual affiliation notifications to certificate of need reviews — were enacted across 24 states in 2023.2 Federal proposals to create a new agency or task force to monitor, oversee, and intervene in health care markets have also been discussed.3 To further promote competition in health care markets, the U.S. Department of Health and Human Services recently named its first chief competition officer.4
- U.S. Department of Justice and U.S. Federal Trade Commission. 2023 Draft Merger Guidelines. Washington, DC: U.S. Department of Justice and U.S. Federal Trade Commission; 2023. https://www.justice.gov/d9/2023-12/2023%20Merger%20Guidelines.pdf. Back to text ↑
- Scotti S and Davenport K. 2023 Legislative Recap: Health Care Consolidation and Competition. National Conference of State Legislatures. https://www.ncsl.org/state-legislatures-news/details/2023-legislative-recap-health-care-consolidation-and-competition. Published Sept. 28, 2023. Accessed Nov. 28, 2023. Back to text ↑
- Dafny L. Addressing consolidation in health care markets. JAMA. 2021;325(10):927-928. doi:10.1001/jama.2021.0038. https://jamanetwork.com/journals/jama/fullarticle/2776037. Back to text ↑
- U.S. Department of Health and Human Services Press Office. Secretary Becerra names chief competition officer to help identify areas to promote competition in health care. Jan. 8, 2024. https://www.hhs.gov/about/news/2024/01/08/secretary-becerra-names-chief-competition-officer-to-help-identify-areas-to-promote-competition-in-health-care.html. Back to text ↑
Health systems argue that consolidation has been driven by financial pressures as well as opportunities to eliminate excess capacity, integrate care for patients, gain efficiencies, and improve leverage for negotiating with private insurers, among other reasons.5 Indeed, the extensive consolidation of the insurance industry has played a large role in dictating how health systems compete in the marketplace. This analysis seeks to examine and compare the market share of providers and insurers in order to show the implications of consolidation across the two industries.
- Medicare Payment Advisory Commission. Report to the Congress: Medicare Payment Policy. Washington DC: Medicare Payment Advisory Commission; 2020. https://www.medpac.gov/wp-content/uploads/import_data/scrape_files/docs/default-source/reports/mar20_entirereport_sec.pdf. Back to text ↑
To shed light on the presence of market consolidation, we assessed the market share of each health system (defined as at least one hospital and at least one group of physicians providing comprehensive care connected with each other through common ownership or joint management) by looking at the health systems with the largest shares of inpatient hospital discharges in each state. We then compared those to the market share of the largest large-group insurers in each state as measured by enrollment.
While most critiques of health care consolidation have focused on hospitals within a metropolitan statistical area (MSA) and insurers at the national level, we suggest that states are a potentially useful unit of analysis given patient mobility, virtual care, and the fact that licensure and insurance are often regulated at the state level.
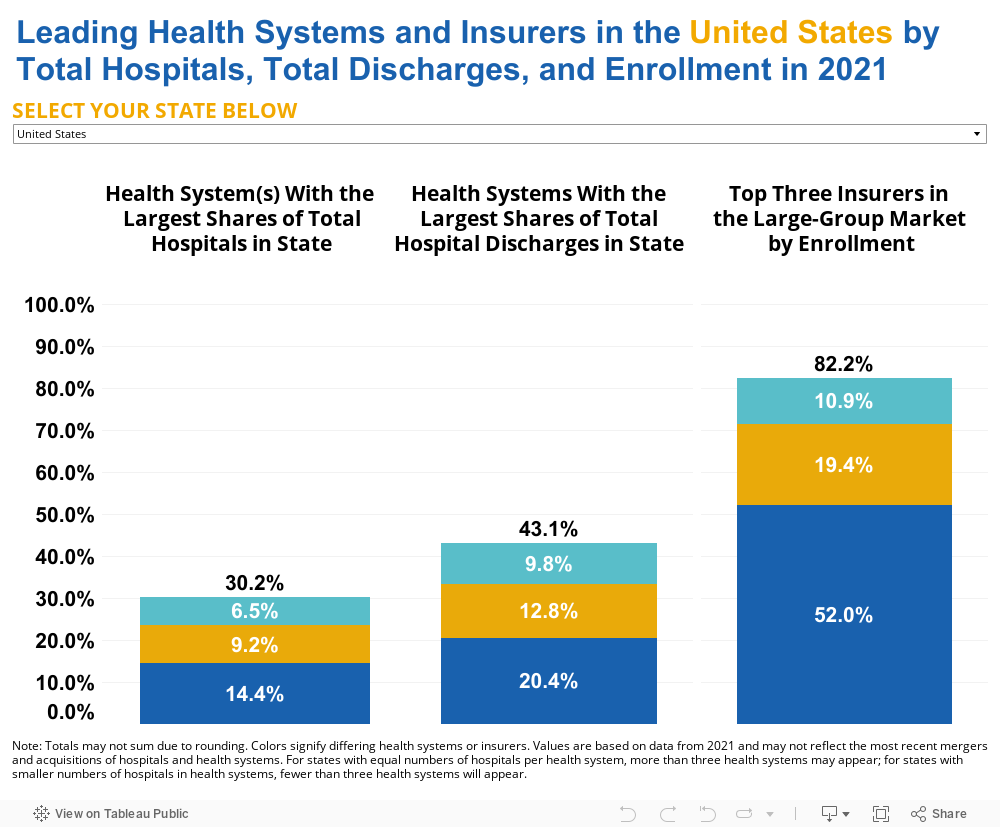
Overall, our data show that the largest health systems have, on average, a combined 43.1% of the market share (as measured by total inpatient hospital discharges) in each state, while the top three large-group insurers hold an average of 82.2% of the market share in each state. For instance, in North Carolina, the largest health systems — Atrium Health (20.3% of inpatient hospital discharges), University of North Carolina Health Care System (14.9%), and Novant Health (14.4%) — have a combined market share of 49.6% in the state. But the largest insurers — Blue Cross Blue Shield of North Carolina (74.9%), UnitedHealth Group (16.2%), and Cigna Health Group (4.4%) — have a combined 95.5% of the market share. Likewise, in Massachusetts, the largest health systems — Mass General Brigham (19.8% of inpatient hospital discharges), Beth Israel Lahey Health (19.5%), and Steward Health Care System (8.3%) — have a combined 47.6% of the market share in the state. But the largest insurers, those with the highest enrollment, in Massachusetts — Blue Cross Blue Shield of MA (60.7%), Point32Health, Inc. Group (23.5%), and UnitedHealth Group (4.2%) — have a combined 88.4% of the market share. Interestingly, in California, Kaiser Permanente dominates the market, as both the health system with the most discharges (13.1%) and the largest insurer (51.6%).
The figure below shows the health systems with the largest shares of total hospitals in each state, the health systems with the largest shares of total inpatient hospital discharges (all-payers) in each state, and the top three insurers in the large-group market by enrollment.
Why This Matters
Hospitals and health systems are primarily paid for the services they provide through reimbursement from private insurers as well as federal programs like Medicare and Medicaid. In recent decades, Medicare and Medicaid have set reimbursement rates for most providers, including hospitals, at lower rates than the cost of delivering care, while private payers have reimbursed about twice as much as their public counterparts.6 Health systems do not negotiate with government payers since reimbursement is set at the federal or state level. However, private insurers and health systems negotiate rates for services7 and the market share that each party maintains is an important factor in these negotiations. When the market share of an insurer far exceeds the market share of an individual health system — as is the case in most states, according to our analysis — that can negatively impact the amount that insurers are willing to pay hospitals and health systems for patient care. Indeed, consolidation of commercial insurers has been associated with lower payments to providers because of improved market power during negotiations.8 9 Lower reimbursements may then result in a reduction in the types of services offered or even (in extreme cases), the closure of practices or hospitals.
- Grover A, Orgera K, Pincus, L. Health Care Costs: What’s The Problem? Washington, DC: AAMC; 2022. https://doi.org/10.15766/rai_dozyvvh2. Back to text ↑
- Grover A, Dreyer T. Surprise! Why Medical Bills Are Still a Problem for U.S. Health Care. Washington, DC: AAMC; 2022. https://doi.org/10.15766/rai_evi4pmqb. Back to text ↑
- Office of the Assistant Secretary for Planning and Evaluation. Environmental Scan on Consolidation Trends and Impacts in Health Care Markets. Washington, DC: U.S. Department of Health and Human Services; 2022.
https://www.aspe.hhs.gov/sites/default/files/documents/db9c716b184c36a6c1d4d68c066b3bc3/enviromental-scan-consolidation-hcm.pdf?_ga=2.234497947.428962588.1689790943-1093863200.1644972357. Back to text ↑ - Scheffler RM, Arnold DR. Insurer market power lowers prices in numerous concentrated provider markets. Health Aff. 2017;36(9):1539-1546. doi:10.1377/hlthaff.2017.0552. https://www.healthaffairs.org/doi/10.1377/hlthaff.2017.0552?url_ver=Z39.88-2003&rfr_id=ori%3Arid%3Acrossref.org&rfr_dat=cr_pub++0pubmed. Back to text ↑
Notably, consolidation of health systems has been associated with higher bill prices10 , as hospitals use prices (or charges) as an entry to negotiations with private payers. While bill prices do not equate to out-of-pocket costs (or even to reimbursements/payments to providers) for those who are privately or publicly insured, they can negatively affect those patients who are uninsured or who face a large cost-sharing burden. There is some evidence that higher prices among hospitals are associated with higher health care spending among privately insured patients in a given market; however, insurer consolidation is also associated with higher premiums, higher spending, and lower rates paid to providers.11
- Office of the Assistant Secretary for Planning and Evaluation. Environmental Scan on Consolidation Trends and Impacts in Health Care Markets. Washington, DC: U.S. Department of Health and Human Services; 2022. https://www.aspe.hhs.gov/sites/default/files/documents/db9c716b184c36a6c1d4d68c066b3bc3/enviromental-scan-consolidation-hcm.pdf?_ga=2.234497947.428962588.1689790943-1093863200.1644972357. Back to text ↑
- Office of the Assistant Secretary for Planning and Evaluation. Environmental Scan on Consolidation Trends and Impacts in Health Care Markets. Washington, DC: U.S. Department of Health and Human Services; 2022. https://www.aspe.hhs.gov/sites/default/files/documents/db9c716b184c36a6c1d4d68c066b3bc3/enviromental-scan-consolidation-hcm.pdf?_ga=2.234497947.428962588.1689790943-1093863200.1644972357. Back to text ↑
Hospitals and Health Systems Within States
Another concern among policymakers has been the increasing trend among health systems of buying up large numbers of hospitals within their states or regions. Despite this consolidation, our analysis shows that the largest health systems by hospital share account for less than a third (30.2%) of the share of all short-term, acute care, children’s, and critical access hospitals, on average across states. For instance, in Indiana, the health systems with the largest share of total hospitals are Ascension Health (13.9%), Indiana University Health (11.3%), Franciscan Health (8.7%), and Community Health Systems (8.7%). Together, these four systems own 42.6% of all the hospitals in Indiana.
By contrast, the three largest insurers in Indiana — Elevance Health (68.9%), UnitedHealth Group (17.1%), and Physicians Health Plan of Northern Indiana (5.3%) — represent 91.2%12 of all privately insured patients with insurance from the large-group market.
- Values do not sum to total due to rounding. Back to text ↑
The number of hospitals in a system is not, by itself, a useful measure — systems with several small hospitals may have less combined inpatient volume than a single, large hospital. For instance, in Tennessee, the health system with the largest number and percentage of total hospitals in the state (Ballad Health, 11.0%) accounts for only 8.9% of total discharges in the state. In Kentucky, the health system with the largest share of hospitals in the state (Appalachian Regional Healthcare System, 12.2%) accounts for just 4.7% of total discharges in the state.
Private Insurance Market Is Highly Concentrated Within States
Based on our analysis, the number of health systems in the United States has not changed substantially in recent years — from 626 in 2016, to 637 in 2018, to 635 in 2021. New health systems identified in 2021 data and not identified in 2018 data can be attributed to new systems forming through mergers and acquisitions and acute care hospitals integrating with more physicians.13 But the number of insurers has declined from 2011 to 2020, decreasing from 640 to 472 large-group market insurers; the individual market saw an even larger drop from 1,529 insurers to 563.14 Nationally, the distribution of private insurers appears competitive (e.g., UnitedHealth Group at 14%, Elevance Health at 12%, and CVS [Aetna] at 11%)15 but this perspective looks different at the state level with certain companies holding an outsized share of the commercial market (Figure 2).
- Contreary K, Chatrath S, Jones DJ, Cohen G, Miller D, Rich E. Consolidation and Mergers Among Health Systems In 2021: New Data From the AHRQ Compendium. Health Affairs Forefront. https://www.healthaffairs.org/content/forefront/consolidation-and-mergers-among-health-systems-2021-new-data-ahrq-compendium. Published June 20, 2023. Accessed Jan. 26, 2024. Back to text ↑
- United States Government Accountability Office. Report to Congressional Committees: Private Health Insurance. Washington DC: United States Government Accountability Office; 2022. https://www.gao.gov/assets/gao-23-105672.pdf. Back to text ↑
- American Medical Association. Competition in Health Insurance: A Comprehensive Study of U.S. Markets. Chicago, IL: American Medical Association; 2023. https://www.ama-assn.org/system/files/competition-health-insurance-us-markets.pdf. Back to text ↑
For example, in Alabama, Blue Cross Blue Shield holds 95.2% of the large-group market. In Louisiana, Louisiana Health Services Group represents 70.0% of all privately insured patients in the large-group market. And in Oklahoma, Health Care Service Corporation has 73.2% of the large-group market. The latter insurers are both independent licensees of Blue Cross Blue Shield.
The figure below shows the percentage of total enrollment of the three largest insurers by individual, small-group, and large-group markets.
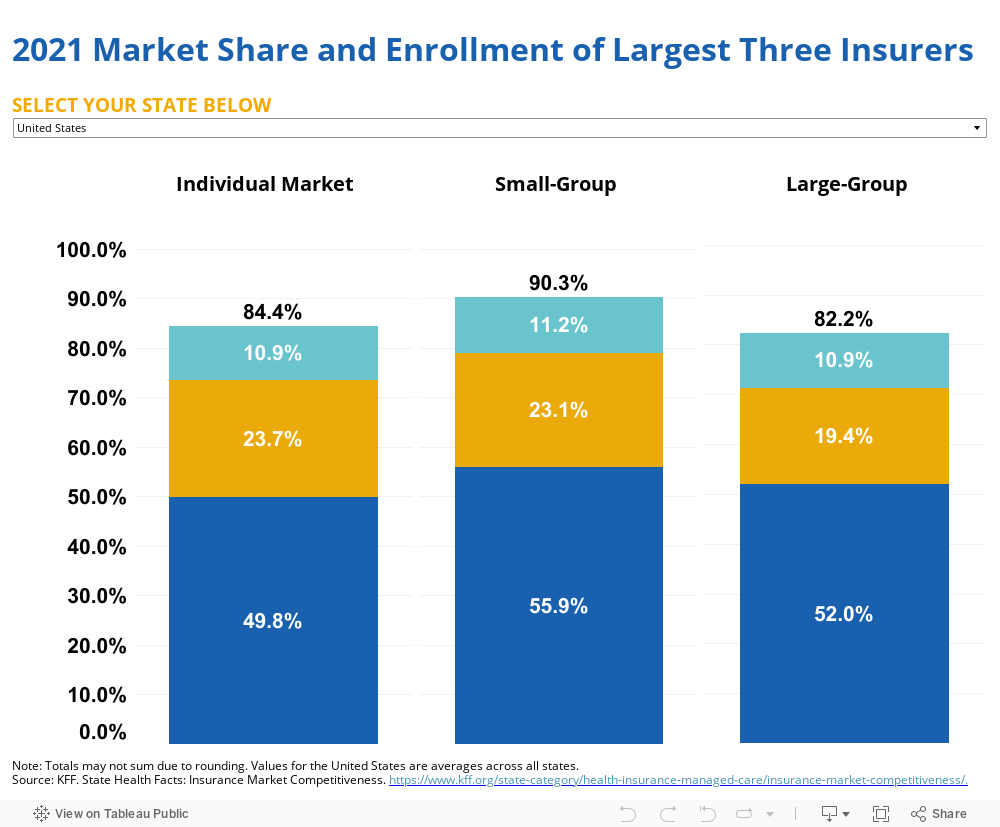
This increased consolidation of insurers suggests that policymakers’ exclusive focus on regulating provider consolidation is problematic. Insurer consolidation has resulted in lower prices (or charges), but the impact on reimbursements to providers is unclear. Importantly, there has not been evidence of reduced premiums for patients and some studies have found evidence that insurer consolidation increases premiums.16
- Office of the Assistant Secretary for Planning and Evaluation. Environmental Scan on Consolidation Trends and Impacts in Health Care Markets. Washington, DC: U.S. Department of Health and Human Services; 2022. https://www.aspe.hhs.gov/sites/default/files/documents/db9c716b184c36a6c1d4d68c066b3bc3/enviromental-scan-consolidation-hcm.pdf?_ga=2.234497947.428962588.1689790943-1093863200.1644972357. Back to text ↑
Insurers are also increasingly acquiring physician practices at a rate higher than hospitals and health systems are acquiring physician practices. Private equity and other physician groups have acquired the largest share of physicians in the last five years (65% and 14% of all physician practice acquisition deals in the United States, respectively). Health insurers acquired the third most (11%)17 ; one insurer, Optum, now employs over 10% of all practicing physicians in the United States.18
- American Hospital Association. Setting the Record Straight: Private Equity and Health Insurers Acquire More Physicians Than Hospitals Infographic. https://www.aha.org/infographics/2023-06-26-setting-record-straight-private-equity-and-health-insurers-acquire-more-physicians-hospitals. Published June 2023. Accessed Feb. 20, 2024. Back to text ↑
- Wilson, R. Optum now has 90,000 physicians. Becker’s Hospital Review. https://www.beckershospitalreview.com/legal-regulatory-issues/optum-added-nearly-20-000-physicians-in-2023.html. Published Nov. 29, 2023. Accessed Feb. 20, 2024. Back to text ↑
Further regulation of health system consolidation should specifically analyze costs and reimbursements/payments in addition to prices/charges, and must take into consideration the impact of consolidation in the insurer market, which may have more deleterious effects on patients when it comes to the availability of services and providers, out-of-pocket costs, and quality of care. Providers and suppliers outside of traditional health systems are also highly concentrated (e.g., dialysis providers and electronic health record vendors) at the national level 19 20 and may raise the cost of episodes of care. Courts and regulators seeking to level the playing field in health care markets should examine how consolidation of both insurers and providers of health care services within states, regions, and nationally (as well as within specific MSAs) may affect access, cost, and quality of care.
- Levin DI, Lingam T, Janiga NJ. 2020 Outlook: Dialysis Clinics andX ESRD. HealthCare Appraisers. https://healthcareappraisers.com/2020-outlook-dialysis-clinics-and-esrd/. Published March 6, 2020. Accessed Feb. 20, 2024. Back to text ↑
- Bruce G. EHR vendor market share in the U.S. Becker’s Hospital Review. https://www.beckershospitalreview.com/ehrs/ehr-vendor-market-share-in-the-us.html. Published May 23, 2023. Accessed Feb. 20, 2024. Back to text ↑
Methods
Analyses utilized data from the Agency for Healthcare Research and Quality (2021 Compendium of U.S. Health SystemsHospital Linkage File), American Hospital Association (AHA) (Annual Survey Database [ASDB], Fiscal Year [FY] 2021), and the Centers for Medicare & Medicaid Services (CMS) Healthcare Cost Report Information System (HCRIS) (2021 HCRIS, S3-Part1-Line 14-Column 15). Hospitals included in the analyses were short-term, acute care hospitals, critical access hospitals, and children’s hospitals in the 50 states and District of Columbia. Primary service and control codes in AHA’s ASDB data were used to identify excluded hospitals, alongside manual identification of: long-term care facilities, Veterans Affairs and military-based hospitals, specialty-only hospitals, federal hospitals, behavioral health centers and treatment facilities, and hospitals within the prison system. These hospitals were then merged with the FY 2021 HCRIS data to compute the total number of inpatient discharges across hospitals by CMS Certification Number. Hospitals with less than six months of data in the cost reports were also dropped from the analyses. In cases where hospitals had more than one cost report for FY 2021, the number of discharges was summed if there was no overlap in the timing of the reports; otherwise, we used the reports with the greatest number of days. Total discharges by state were then used to calculate the percentage of discharges by each health system in each state. In Maryland and Mississippi, we used 2020 HCRIS data for two hospitals due to the large and unexplained increases in discharges in 2021. We used 2021 HCRIS for all other hospitals in each state. For the share of hospitals data, more than three health systems may appear in the visualization due to equal numbers of hospitals per health system; some states may have fewer than three due to smaller numbers of hospitals in health systems. Insurer data came from KFF's State Health Facts Insurance Market Competitivenessindicators for the individual, small-group, and large-group markets.