Figure 1
Overview
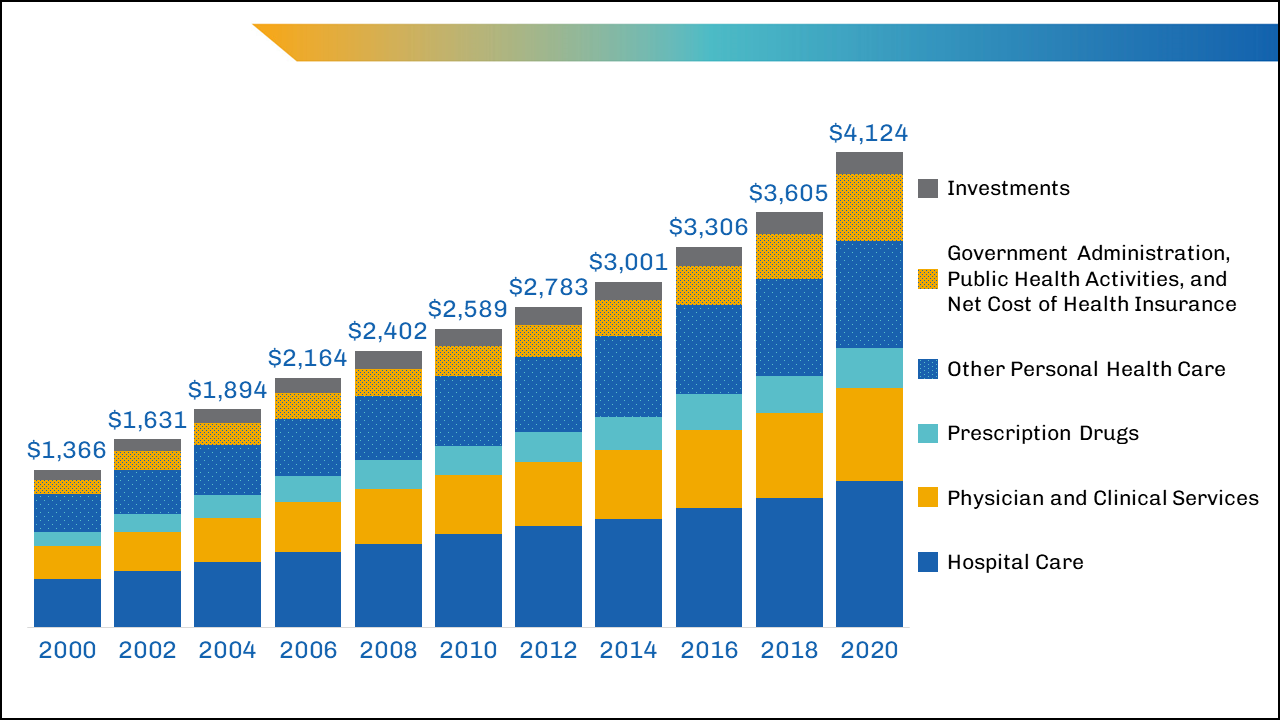
The figure shows stacked national health care spending by type of expenditure every two years from 2000-2020. It shows that U.S. health care spending has increased every two years since 2000. From bottom to top of stacked bar, the types of expenditures are Hospital Care; Physician and Clinical Services; Prescription Drugs; Other Personal Health Care; Government Administration, Public Health Activities, and Net Cost of Health Insurance; and Investments. Hospital Care; Physician and Clinical Services; Other Personal Health Care; and Government Administration, Public Health Activities, and Net Cost of Health Insurance were the types of expenditures that accounted for the largest shares of total spending. Prescription Drugs and Investments made up the smallest shares of total spending throughout the years.
Values
| Year | Spending ($ billions) |
|---|---|
| 2000 | $1,366 |
| 2002 | $1,631 |
| 2004 | $1,894 |
| 2006 | $2,164 |
| 2008 | $2,402 |
| 2010 | $2,589 |
| 2012 | $2,783 |
| 2014 | $3,001 |
| 2016 | $3,306 |
| 2018 | $3,605 |
| 2020 | $4,124 |
Presentation
The stacked bar chart includes years, total national health care spending, and the distribution of types of expenditures. Years are represented at the base of each bar on the x-axis, listed horizontally in chronological order. The national health care spending total is listed at the top of each bar. Within each vertical bar are six types of expenditures stacked and summing to the national total for each year. Types of expenditures are represented by color blocks in each column designated as: Hospital care (dark blue), Physician and Clinical Service (gold), Prescription Drugs (light blue), Other Personal Health Care (dark blue with yellow dots), Government Administration, Public Health Activities, and Net Cost of Health Insurance (gold with medium-sized blue dots), Investments (gray).